Business Intelligence
Make the Most of Your Data
Making decisions that are based less on gut feeling and more on facts: We support companies in making data-driven decisions through the targeted processing and visualization of data. With clear and easy-to-use dashboards you increase the so-called ‘data literacy’ of your employees.
We Have a Lot of Data, But What Can We Do With It?
Many companies collect large amounts of data on their own, but these
are often distributed in different databases or silos and are
difficult for the business departments to access. Self-created
isolated solutions are often unsustainable because they are
difficult for IT staff to maintain due to a lack of company-wide
standards, and there are few employees in the business departments
who have the appropriate skills for maintenance and further
development.
As a data science company, we support you in implementing your data strategy.
The functionalities and data sources required for your business processing
are identified with the relevant stakeholders. Data silos and legacy
systems are linked together using a data mesh approach or transferred
to a central data lake architecture, which accelerates the preparation
of diverse use cases using a smart layer concept. Such a use case can,
for example, be a business intelligence environment. Further, we support
you in the choice of technology, depending on your requirements and existing
systems, and work with you to design a clear reporting concept in which
all relevant key figures and information are visualized in a simple and
comprehensible way. In addition to standard reports, possibilities for
ad-hoc analyses, as well as the integration of customized visualizations
can be created. To ensure the broadest possible access and extensive
use by your employees, we also provide support during roll-out and key
user training.

Example: Energy Sector
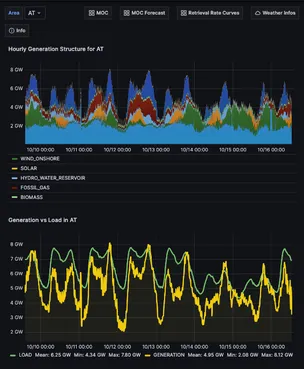
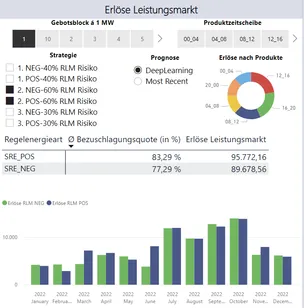
Our customers in the energy sector need to recognize short-term changes in the electricity market at an early stage in order to be able to adapt trading strategies. In addition to their own generation data, weather and market data are also important for various analyses. We have developed our data donkey specifically for the FlexPowerHub platform, which picks up the essential data points and feeds the data into our system for further processing. There, the data is automatically analyzed and finally visualized in various business intelligence tools, according to our customers' specifications. This way, market participants always have an overview of the current market behavior and can adapt their bidding strategies for the relevant energy auctions accordingly.

How Could cognify Support This Project?
How Our Customers Benefit
With years of experience in data engineering and data visualization, we support companies in making data-driven decisions at the operational and strategic level. If the company is not independently able to obtain the required data, we can also cover this need. In this way, time-consuming manual tasks such as market surveillance and monitoring can be embedded in an almost fully automated process, so that companies can concentrate more on their key business processes.
